Resume-aware faculty matching

Find professors who actually fit you

Upload your resume. Four AI agents analyze your background, rank the faculty who fit, inspect their recent research, and help you draft outreach — grounded in their actual work, not templates.

Free to startNo credit cardCancel anytime
Top matches Balanced preset
Dr. Sarah Chen
Stanford · Interpretability · NLP
91
Dr. Marcus Holloway
MIT · Robotics · RL
84
Dr. Aisha Okonkwo
CMU · Fairness · HCI
82
Nova · Professor Researcher · re-ranking top 20…
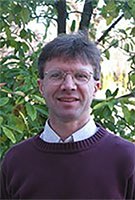
Kenneth Davis

Kenneth Davis

Verified

Pennsylvania State University · Pathology

Active 1978–2026

h-index83
Citations35.6k
Papers634129 last 5y
Funding$375k
See your match with Kenneth Davis — sign in to PhdFit.Sign in

About

Kenneth Davis is a Professor of Atmospheric and Climate Science at Penn State University. His role involves engaging in research that impacts real-world problems related to atmospheric and climate phenomena. As part of Penn State's College of Agricultural Sciences, his work contributes to the broader mission of the land-grant institution, emphasizing research, education, and extension activities in agricultural and environmental sciences.

Research topics

  • Environmental science
  • Geology
  • Geography
  • Atmospheric sciences
  • Computer Science
  • Biology
  • Meteorology
  • Chemistry
  • Ecology
  • Information Retrieval
  • Climatology
  • Environmental engineering
  • Data Mining
  • Oceanography
  • Statistics
  • Physics
  • Engineering
  • Soil science
  • Database
  • Remote sensing
  • World Wide Web
  • Programming language
  • Agronomy
  • Economics

Selected publications

  • Baltimore Social-Environmental Collaborative (BSEC) Doppler Lidar & Derived Products

    DOE Pacific Northwest National Laboratory (PNNL) Repository · 2026-04-09

    datasetOpen accessSenior author

    This repository contains all processed Doppler‐lidar outputs from the PSU lidar deployed for the Baltimore Social‐Environmental Collaborative (BSEC) project. Vertical Stare Scans (fixed‐beam, vertical profiling): 1 Hz backscatter intensity (m⁻¹ sr⁻¹), signal‐to‐noise ratio (unitless), and Doppler vertical‐velocity (m s⁻¹) on 30 m range gates (and 3 m range gates), stored as CF-compliant NetCDF. Wind Profiles (horizontal‐wind retrieval): daily NetCDF outputs of retrieved horizontal wind speed (m s⁻¹) and direction (degrees), computed from the angled‐scan returns. Profile Statistics (summary statistics on the vertical velocity): 15 min windows (default) of mean, variance, skewness, kurtosis, high-frequency variance, etc., as a function of height; saved as CF-compliant NetCDF files. Boundary Layer Height (BLH) (fuzzy-logic output): 15 min BLH estimates (m), with lower/upper fuzzy bounds (m) and a quality flag (0–4) indicating data status (e.g., no data, good, ran out of signal, below range, cloud-topped). Cloud Base Height (Haar-gradient detection): 10 min estimates of cloud-base height (m). All five product streams are organized by year and date under their own top-level folders (01_Vertical_Stare_Scans/ through 05_Cloud_Height/). Each folder contains a data_<type>/YYYY/ subdirectory with daily CF-compliant NetCDF outputs (96 windows per day at 15 min intervals). Global attributes in each file include creation history, version (3.0.0), institution, and source. Instrument & MeasurementsThe PSU Doppler Lidar samples aerosol backscatter (m⁻¹ sr⁻¹), signal-to-noise ratio, and radial velocity at ~1 Hz. Vertical stare scans point the beam straight up; after collecting angled scans through multiple elevation angles, the "Wind Profiles" product contains the fully retrieved horizontal wind speed and direction. Data were collected continuously at ~30 m range resolution (and 3 m for the year of 2025), with a typical height ceiling of ~12 km. How to Use Open any NetCDF with Python's xarray, MATLAB, or similar CF-compliant tools. Stare scans and angled-scan retrievals (Wind Profiles) are CF-compliant daily NetCDF files. Profile-Statistics, BLH, and Cloud Height files are daily 15 min (10 min for Cloud Heights) summaries (96 time steps per file). Inspect the included variables (e.g., vertical_velocity_variance, wind_speed, BLH, cloud_base_height) for your analyses. Use the quality flags (BLH_flag, cloud_flag) to filter out poor-quality retrievals. For more information or questions about processing methods, please contact:Nicholas E. Prince ⟨nec5299@psu.edu⟩Penn State Department of Meteorology & Atmospheric Science

  • Evaluation of Aircraft-based Methane Emissions Estimates and Estimation Methodologies with Six Years of Data from Indianapolis

    2026-05-15

    articleOpen access

    Indianapolis CH 4 emissions are 49 16 mol s -1 , with the South Side Landfill contributing 27 10 mol s -1 Boundary layer entrainment must be corrected when using upwind flights to define CH 4 background concentrations A mesoscale CH 4 model can filter complex background days, reducing emission variance by 25% in the case of Indianapolis

  • Improved Comparability and System-Wide Verification to Support a Scalable Carbon Credit Market

    2026-01-04

    articleOpen access

    Abstract. Achieving net-zero emissions over the coming decades requires unprecedented reductions in anthropogenic emissions of greenhouse gases (GHGs) complemented by a rapid ramp-up in the magnitude of global carbon dioxide removal (CDR). The carbon credit market (CCM) is emerging as a means to finance both emissions reductions and carbon dioxide removal from the atmosphere. To achieve necessary growth on these fronts, the total scope and diversity of projects that are candidates for inclusion in the CCM must expand, necessitating a means of comprehensively assessing the quality of carbon credit projects (CCPs) based on their ability to make quantifiable reductions to GHG concentrations in the atmosphere. Toward a comprehensive quality assessment, we propose a framework to assess and differentiate CCPs based on their estimated impact on atmospheric GHG composition. In parallel, we propose a path towards verification of the aggregated atmospheric impact of CCM actions, since a detectable and attributable signal in atmospheric GHG composition can be viewed as the clearest measure of their climate forcing and, therefore, effectiveness.

  • Evaluating an Atmospheric Dynamic Downscaling Approach from Mesoscale to the Neighborhood Scale Using Large-Eddy Simulations

    2025-05-21

    preprintOpen accessSenior authorCorresponding

    Understanding and modeling conditions at the neighborhood scale is essential for addressing weather and climate impacts on urban communities. Mesoscale weather models provide information at horizontal resolutions of a few kilometers. Such resolutions are still too coarse to represent environmental conditions at neighborhood scales of tens of meters or smaller experienced by individual residents. On the other hand, microscale urban simulations are often limited by stationary boundary conditions from mesoscale weather models and relatively small spatial extents. We evaluate a dynamic downscaling approach that bridges the gap between mesoscale and neighborhood scales using multi-nested WRF-LES model simulations. Our simulations implement recently developed or updated meter-resolution static (land cover, soil, building, topographic, etc.) data to represent the unique urban environments within Baltimore, MD. We then assess model performance using remote sensing, surface weather, surface flux, soil, biophysical, and boundary layer profile observations affiliated with the Baltimore Social-Environmental Collaborative (BSEC) and Coastal Urban-Rural Atmospheric Gradient Experiment (CoURAGE), paying particular attention to surface layer turbulence profiles. We will share lessons learned through our model development and validation efforts, especially the impacts of the description of the complex urban land surface on atmospheric turbulence and neighborhood-level climate conditions. We endeavor to contribute to the ongoing effort to improve urban modeling across scales.

  • Urban Eddy Covariance – The INFLUX Network

    2025-06-16

    preprintOpen accessSenior authorCorresponding

    Abstract. The eddy covariance method is used by various disciplines to measure surface-atmosphere fluxes of both vector and scalar quantities. However, eddy covariance observations are uncommon in urban areas. One of the few long-term and ongoing urban flux experiments is the Indianapolis Flux Experiment (INFLUX), which has successfully deployed eddy covariance towers at eleven locations measuring fluxes from various land cover types in and around the urban environment. The data collected from this network of towers has been used to determine urban greenhouse gas emissions, assess transport model performance, and separate anthropogenic from biogenic sources. This paper describes the available data associated with the INFLUX eddy covariance network, provides details of data processing and quality control, and provides site attributes needed to interpret the data. For access to the various data products from the INFLUX eddy covariance work, please see the data availability section below.

  • Estimating and Evaluating Roughness Length and Displacement Height in Heterogeneous Urban Environments

    Boundary-Layer Meteorology · 2025-05-21

    preprintOpen accessSenior author

    Abstract The roughness length ( $$z_0$$ <mml:math xmlns:mml="http://www.w3.org/1998/Math/MathML"> <mml:msub> <mml:mi>z</mml:mi> <mml:mn>0</mml:mn> </mml:msub> </mml:math> ) and displacement height ( $$z_d$$ <mml:math xmlns:mml="http://www.w3.org/1998/Math/MathML"> <mml:msub> <mml:mi>z</mml:mi> <mml:mi>d</mml:mi> </mml:msub> </mml:math> ) are essential surface-layer parameters in numerical models (e.g., weather, climate, wall-modeled LES, etc.). This work evaluates the consistency of $$z_0$$ <mml:math xmlns:mml="http://www.w3.org/1998/Math/MathML"> <mml:msub> <mml:mi>z</mml:mi> <mml:mn>0</mml:mn> </mml:msub> </mml:math> and $$z_d$$ <mml:math xmlns:mml="http://www.w3.org/1998/Math/MathML"> <mml:msub> <mml:mi>z</mml:mi> <mml:mi>d</mml:mi> </mml:msub> </mml:math> estimates from morphometric and anemometric methods using data from two eddy-covariance flux towers (AmeriFlux US-INg and US-INc) in Indianapolis, IN. Results show inconsistencies in estimated $$z_0$$ <mml:math xmlns:mml="http://www.w3.org/1998/Math/MathML"> <mml:msub> <mml:mi>z</mml:mi> <mml:mn>0</mml:mn> </mml:msub> </mml:math> and $$z_d$$ <mml:math xmlns:mml="http://www.w3.org/1998/Math/MathML"> <mml:msub> <mml:mi>z</mml:mi> <mml:mi>d</mml:mi> </mml:msub> </mml:math> values depending on the chosen method. The two evaluated anemometric methods estimate non-physical values of $$z_d$$ <mml:math xmlns:mml="http://www.w3.org/1998/Math/MathML"> <mml:msub> <mml:mi>z</mml:mi> <mml:mi>d</mml:mi> </mml:msub> </mml:math> when compared to roughness elements surrounding both towers. Additionally, predictions of mean wind speed using surface-layer similarity theory with morphometric estimates exhibit a bias during near-neutral and stable conditions relative to observations. The overestimation of mean wind speed by surface layer similarity theory is consistent with previous observational and modeling studies in urban areas, suggesting that the application of similarity theories to urban environments may have limitations. Differentiation of vegetation from built structures appears to impact morphometric $$z_0$$ <mml:math xmlns:mml="http://www.w3.org/1998/Math/MathML"> <mml:msub> <mml:mi>z</mml:mi> <mml:mn>0</mml:mn> </mml:msub> </mml:math> and $$z_d$$ <mml:math xmlns:mml="http://www.w3.org/1998/Math/MathML"> <mml:msub> <mml:mi>z</mml:mi> <mml:mi>d</mml:mi> </mml:msub> </mml:math> estimates, particularly where vegetation is abundant; however, it has little impact on correcting biases in the similarity theory. Specifically, we find that existing similarity theories using morphometric estimates underestimate integral velocity and length scales, and the degree of underestimation depends on the stability conditions. Accounting for the degree of anisotropy in surface-layer turbulence helps reduce the biases between similarity theories and observations during unstable conditions, but not in near-neutral cases. Future work is needed to identify the cause of such biases for near-neutral conditions.

  • CoURAGE! The Coast-Urban-Rural Atmospheric Gradient Experiment

    2025-05-21

    preprintOpen access1st authorCorresponding

    Understanding the mechanisms governing the urban atmospheric environment is critical for understanding urban climate change, air quality and associated mitigation and adaptation measures. The Coast-Urban-Rural Atmospheric Gradient Experiment (CoURAGE) studies the complex coastal environment surrounding the U.S. MidAtlantic region city of Baltimore via a deployment of the Department of Energy (DOE) Atmospheric Radiation Measurement (ARM) Mobile Facility (AMF1). AMF1 began operations in Baltimore on 1 December, 2024 and will continue operations through November of 2025. The deployment complements the Baltimore Social-Environmental Collaborative (BSEC), an urban integrated field laboratory designed to advance our ability to simulate and project urban climate conditions.CoURAGE creates a four-node regional atmospheric observatory network including Baltimore and its three surrounding environments - rural, urban and bay. The AMF1 deployment includes a main site in the city of Baltimore and ancillary sites in rural Maryland, and on an island within the Chesapeake Bay. AMF1 complements a Howard University and Maryland Department of the Environment atmospheric observatory southwest of the city.CoURAGE investigators are studying the interactions among the earth’s surface, the atmospheric boundary layer, aerosols and atmospheric composition, clouds, radiation and precipitation. Observations show striking and persistent differences in the surface energy balance, atmospheric composition and boundary layer clouds across this gradient, in addition to mesoscale flows such as bay breezes and low-level jets. This presentation will describe the CoURAGE science plan, present the multi-variate observational record emerging from AMF1 and BSEC, and describe our work to date to simulate this complex coastal environment.We hypothesize that accurate simulation of processes that generate these gradients are essential to simulating the urban atmospheric environment. We are working to advance the ability of our numerical modeling systems to simulate this integrated coast-urban-rural system and thus improve the scientific basis for guiding coastal urban climate adaptation and mitigation strategies.

  • The Baltimore Social-Environmental Collaborative integrated urban observing system

    2025-05-21

    preprintOpen access1st authorCorresponding

    The Baltimore Social-Environmental Collaborative is an urban integrated field whose objective is to establish and apply the observations needed to improve urban climate and air quality projections and thus provide an improved scientific foundation for mitigation and adaptation planning. The urban system is complex and demands a multivariate observational approach. BSEC brings together observations of the urban atmosphere, buildings, ecosystems, biogeochemistry and hydrology, providing an integrated view of the city environment.Observations of buildings, soils and ecosystems provide both spatial data and process-oriented measurements needed to construct detailed models of the urban surface. Detailed building data and associated models expand our understanding of how infrastructure impacts the atmospheric environment, the sensitivity of the indoor environment to outdoor conditions, and options for adaptation to extreme heat and poor outdoor air quality. Ecosystems measurements provide data needed to test the representation of urban ecosystems in numerical models and improve our understanding of the impacts of urban greening. Urban soil and hydrology measurements provide a measure of realism needed when simulating the disturbed, complex urban subsurface. This suite of observations are being used to challenge land surface models used to represent cities in urban hydrology and numerical weather models.Atmospheric observations include both the factors that impact human health and comfort, and the composition and dynamics of the atmospheric boundary layer. Separate air quality and weather networks quantify the spatial and temporal variability of these properties across the city. An air quality supersite measures the atmospheric composition properties needed to evaluate and improve urban air quality models. Land-atmosphere flux measurements, surface-layer turbulence profiles, a Doppler lidar and periodic rawinsonde measurements document the temporal evolution of the atmospheric boundary layer.This presentation will describe both the observational network and its application to evaluating the associated urban environmental models.

  • Laboratory and field assessment of mid-infrared absorption (MIRA) instrument performance for methane and ethane dry mole fractions

    2025-10-16

    articleOpen accessSenior authorCorresponding

    Abstract. Concurrent measurements of methane (CH4) and ethane (C2H6) can be used to identify and separate methane sources, as ethane is present in thermogenic sources (e.g., oil and natural gas) but not in biogenic sources (e.g., agriculture). In this study, we evaluated the performance of multiple Aeris MIRA Ultra instruments (Versions 1 and 2) through controlled laboratory tests and tower-based deployments under field conditions. The systems were modified with an external pump, flow control, a Nafion dryer, and a custom-built auxiliary box to automate the system and transmit near real-time data. We determined the best calibration approach for our application, given practical limitations, to be a full calibration cycle (with ambient and high calibration cylinders) about once per day and an ambient calibration cylinder sampled hourly. Measurement uncertainty was assessed, including the uncertainty due to instrument noise as a function of calibration frequency, uncertainty in the water vapor correction, and cylinder assignment uncertainty. Instrument noise was the dominant source of uncertainty for C2H6, while the water vapor correction dominated the CH4 uncertainty. For Version 2 systems with hourly calibrations and a Nafion dryer with counterflow, the mean total uncertainty, including both systematic errors and noise, of hourly averages was 0.8–3.0 ppb CH4 and 0.35–0.37 ppb C2H6. Laboratory intercomparisons showed network compatibility within 1.2 ppb CH4 and 0.23 ppb C2H6, and a collocated deployment with a NOAA Picarro system agreed within 1.8 ppb CH4. Instrument noise varied substantially amongst the instruments, with errors reaching up to 11 ppb CH4 and 2 ppb C2H6 for hourly means, with similar variability indicated in a 50-h cylinder test. With appropriate engineering and calibration, the Aeris MIRAUltra shows the capability to measure ethane and methane with sufficient stability to distinguish regional methane emission sources in many field settings.

  • Examining Daily Temporal Characteristics of Oil and Gas Methane Emissions in the Delaware Basin Using Continuous Tower Observations

    Journal of Geophysical Research Atmospheres · 2025-03-19 · 2 citations

    articleOpen access

    Abstract Top‐down studies have found consistent underestimations in the United States Environmental Protection Agency (EPA) methane emissions inventory from the oil and gas (O&amp;G) sector. Many of these studies use observations that bias toward hours when worktime activity occurs. In this study, we analyze over 2 years of methane measurements from a tower network in the Delaware basin to analyze hourly temporal emission patterns. Inversion results suggest a range in emissions from 137 Mg/hr at night to 197 Mg/hr during the day, present during both weekdays and weekends. If these results are applicable to other basins, daytime‐influenced methodologies may overestimate daily emission rates by up to 27%. This bias does not reconcile the more than 200% difference between the EPA inventory and top‐down estimates in the Delaware basin. This study demonstrates how continuous measurement networks can be combined with detailed activity data to improve bottom‐up inventories.

Recent grants

Frequent coauthors

  • Thomas Lauvaux

    Université de Reims Champagne-Ardenne

    280 shared
  • N. L. Miles

    Pennsylvania State University

    147 shared
  • Colm Sweeney

    National Oceanic and Atmospheric Administration

    89 shared
  • J. C. Turnbull

    University of Colorado Boulder

    84 shared
  • Sha Feng

    Pennsylvania State University

    67 shared
  • Zachary Barkley

    Pennsylvania State University

    67 shared
  • Peter S. Bakwin

    66 shared
  • A. Karion

    National Institute of Standards and Technology

    65 shared

Education

  • Ph.D., Astrophysical, Planetary and Atmospheric Science

    University of Colorado Boulder

    1992
  • AB, Physics

    Princeton University

    1987
  • Resume-aware match score
  • Save to shortlist
  • AI-drafted outreach

See your match with Kenneth Davis

PhdFit ranks faculty by your research interests, methods, and publications — grounded in their actual work, not templates.

  • Free to start
  • No credit card
  • 30-second signup